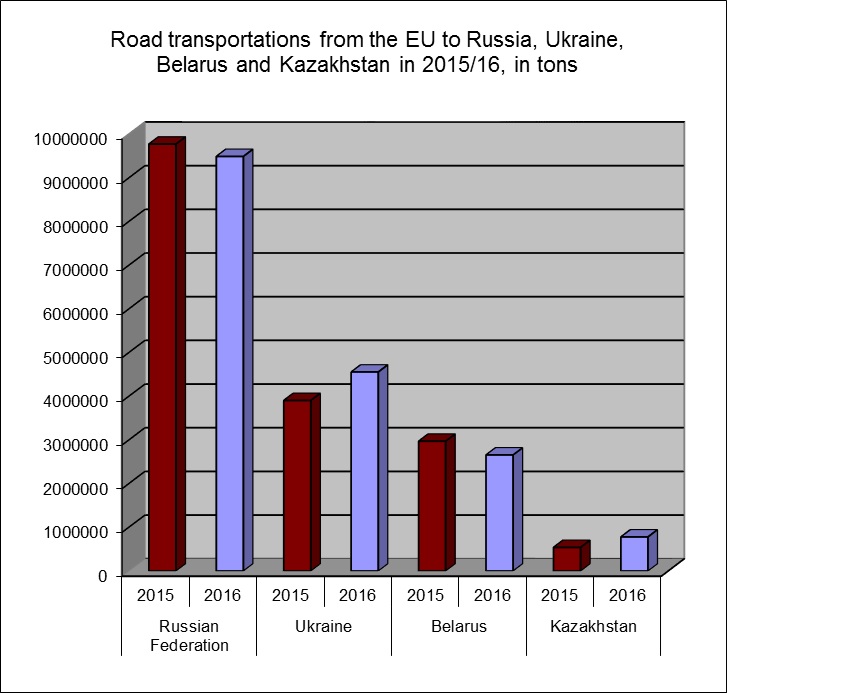
In 2016, road transportation market from the countries of the EU to the major countries of the Eurasian region (Russia, Ukraine, Belarus and Kazakhstan) grew by 1.7% against the year 2015, making 17,483 thousand tons (hereinafter according to the data taken from Eurostat).

The growth in road logistics market in the above mentioned direction was mainly due to a considerable increase of import traffic flow to Ukraine, which was 16.7% more in 2016 over 2015, totaling 4,555 thousand tons. By percentage, there was a considerable increase of imports to the Republic of Kazakhstan – 779 thousand tons (+44.5%). A great volume of electric equipment and component parts exported there made this growth possible – the volume of cargoes expressed in physical terms grew 8 times against July of that year. However, the volume of cargoes came back to its old level in the following months.
Imports to Russia decreased by 2.9% in 2016 over the year 2015, up to 9,490 thousand tons. So, it’s clear that road transportation market between the EU and the Russian Federation has become stable against the great decrease by -32% in 2015 over the year 2014.
The reason for a considerable decrease in the volume of road transportations from the European Union to the Russian Federation in 2015 lies in the Russian economic recession and mutual sanctions between Russia and the European Union, which resulted in a significant reduction of imports (foodstuff and certain types of equipment) to the Russian Federation. Despite the continued recession in Russia, cargo flow from the EU to Russia changed its import commodity structure in 2016, which helped preserve the volume of transportations at the level of the year 2015.
2,657 thousand tons were imported to Belarus in 2016, which is 10.6% less than in 2015. The reduction was mainly due to a decrease of imported vegetables and fruit.
Road transportations from the EU to Russia, Ukraine, Belarus and Kazakhstan in 2015/16, in tons
|
|
Russian Federation |
Ukraine |
Belarus |
Kazakhstan |
||||
|
|
2015 |
2016 |
2015 |
2016 |
2015 |
2016 |
2015 |
2016 |
|
EU (28 countries) |
9773976 |
9491530 |
3904026 |
4555250 |
2971223 |
2656726 |
539377 |
779645 |
|
Germany |
2203813 |
2182707 |
611350 |
725311 |
197955 |
195519 |
112263 |
94143 |
|
Poland |
1417454 |
1279794 |
1387400 |
1676398 |
991628 |
1354821 |
115065 |
115518 |
|
Finland |
1204329 |
1147058 |
112520 |
110398 |
19651 |
22909 |
5487 |
4635 |
|
Netherlands |
633804 |
702621 |
208460 |
226980 |
72936 |
64024 |
39808 |
317302 |
|
Italy |
634223 |
663575 |
155673 |
190893 |
41934 |
41857 |
48439 |
46919 |
|
Lithuania |
633195 |
540154 |
97012 |
105057 |
1330360 |
689229 |
82675 |
65813 |
|
France |
395975 |
391519 |
83056 |
109096 |
20425 |
20353 |
21971 |
21749 |
|
Czech Republic |
365445 |
375157 |
150106 |
159143 |
34256 |
28979 |
13195 |
10892 |
|
Belgium |
310803 |
317023 |
93487 |
115208 |
42133 |
40551 |
20657 |
18057 |
|
Sweden |
272994 |
259475 |
45838 |
51300 |
9901 |
10941 |
3071 |
3184 |
|
Latvia |
275538 |
249682 |
41637 |
42049 |
45744 |
28600 |
5977 |
13888 |
|
Austria |
280187 |
239051 |
76593 |
109925 |
28227 |
22636 |
20593 |
15424 |
|
Hungary |
185690 |
184973 |
234708 |
251567 |
17928 |
17792 |
4298 |
5415 |
|
Estonia |
179465 |
170445 |
52864 |
49917 |
19088 |
24719 |
3030 |
3150 |
|
Romania |
168168 |
156105 |
178814 |
184180 |
10815 |
6672 |
6428 |
5837 |
|
Spain |
128053 |
125849 |
42288 |
44997 |
32503 |
28259 |
13140 |
8104 |
|
Slovakia |
119366 |
120667 |
159222 |
201440 |
19673 |
19916 |
3860 |
2096 |
|
Slovenia |
89768 |
90118 |
23399 |
29341 |
8351 |
8094 |
4655 |
12632 |
|
Great Britain |
80291 |
72278 |
50864 |
57312 |
4734 |
4384 |
6343 |
7969 |
|
Denmark |
61581 |
64260 |
35970 |
44216 |
6417 |
7494 |
1908 |
1420 |
|
Bulgaria |
57074 |
60856 |
29649 |
15647 |
5488 |
5571 |
1968 |
1233 |
|
Greece |
28174 |
37331 |
26721 |
43334 |
5921 |
8236 |
2086 |
1718 |
|
Luxembourg |
23456 |
34661 |
869 |
1633 |
289 |
132 |
97 |
443 |
|
Croatia |
13811 |
13602 |
1704 |
5802 |
2982 |
4332 |
804 |
755 |
|
Portugal |
8182 |
6909 |
2934 |
3195 |
1360 |
346 |
88 |
69 |
|
Ireland |
3134 |
5660 |
888 |
911 |
301 |
219 |
1471 |
1280 |
Marketing Department of TELS Group of Companies, source – Eurostat