IMF Forecasts
1. GDP trends
The global recovery of economic activity is increasing. According to forecasts, world growth, which was lowest in 2016 since the global financial crisis and totaled 3.2 percent, will rise to 3.6 percent in 2017 and 3.7 percent in 2018.
Forecasts are increasing for Europe. According to the forecasts of the International Monetary Fund, Poland’s GDP will grow by 3.8% this year, which is 0.4 percentage points more than forecast in the previous report. In 2018, Poland’s economic growth should reach 3.3%, instead of the previously estimated 3.2%. The analysts of the IMF have corrected their forecasts given the best Poland’s economic indicators in the first half of the current year and the expected acceleration of the projects funded by the EU.
Overview of Poland’s Market
Dynamics of macro-indicators
Foreign trade statistics according to state agencies
|
Jan.-June 2016 |
Jan.-June 2017 |
Absolute increase |
Rate of increase |
|
|
Trade turnover, thousand US dollars |
197366512 |
213780568 |
16414056 |
8.32% |
|
Volume of imports, thousand US dollars |
96009413 |
106396548 |
10387135 |
10.8% |
|
Volume of exports, thousand US dollars |
101357099 |
107384020 |
6026921 |
5.9% |
|
Balance of foreign trade, thousand US dollars |
5347686 |
987472 |
-4360214 |
-81.5% |
According to the Central Statistics Agency of Poland, Polish foreign trade turnover in January-June 2017 amounted to 213.8 billion dollars with an increase of 8.32% over January-June 2016, while exports totaled 107.4 billion dollars (+5.9%) and imports amounted to 106.4 billion dollars (+10.8%). From the total volume of trade in the first half of 2017, 50.2% accounted for exports and 49.8% – for imports. Export surplus resulted in the positive balance of foreign trade turnover, at the same time it was -85.5% less than in January-June 2016 and amounted to 987 million US dollars.
1. Dynamics of foreign trade (according to Eurostat, road transport)
According to Eurostat, the volume of imports expressed in physical terms to Poland from the countries of the European Union in January-June 2017 totaled 16,135,631 tons with an increase of 10.9% over January-June 2016. The volume of exports in January-June 2017 amounted to 17,855,602 tons making an increase of 14.1% over the same period in 2016.
Volumes of the target market (road transport, excluding non-target product groups) for imports in January-June 2017 totaled 15,864,737 tons making an increase of +10.1%, exports grew by 11.9% amounting to 17,429,773 tons over January June 2016.
Poland’s major trading partners
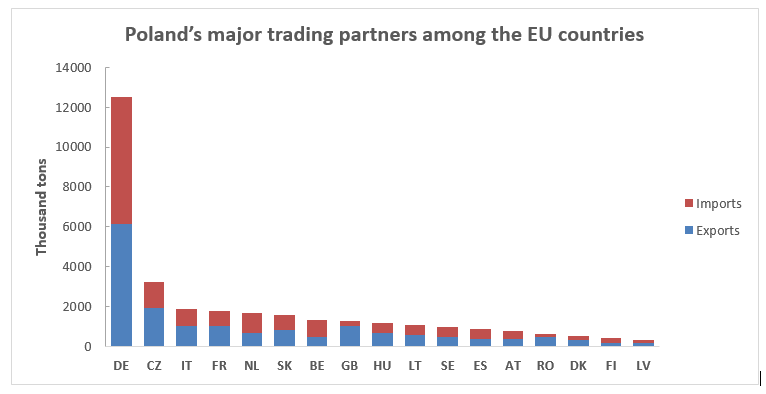
The most important foreign trade partners of Poland among the EU countries in 2016 were Germany, the Czech Republic, Italy, France, the Netherlands, Slovakia, Belgium, the UK, Hungary and Lithuania accounting for 83% of foreign trade turnover.
Speaking about the share of the major partners in foreign turnover in the period under review, 38% accounted for Germany, 10% – for the Czech Republic and 6% – for Italy.

Dynamics in cooperation between Poland and its major trading partners (95% from the overall turnover)
Export trading partners’ ranking in the descending order from the largest share to the lowest in percentage terms
|
Poland’s trading partners (recipient countries) |
Share of recipient countries in the overall export turnover |
Absolute increase |
Rate of increase |
|
6 months in 2017 against 6 months in 2016 |
6 months in 2017 against 6 months in 2016 |
||
|
Germany |
35% |
761 445 |
14% |
|
the Czech Republic |
11% |
148 471 |
8% |
|
France |
6% |
145 783 |
16% |
|
the UK |
6% |
153 263 |
18% |
|
Italy |
6% |
180 450 |
22% |
|
Slovakia |
5% |
44 489 |
6% |
|
Hungary |
4% |
83 070 |
14% |
|
the Netherlands |
4% |
111 919 |
20% |
|
Lithuania |
3% |
126 642 |
29% |
|
Belgium |
3% |
93 399 |
24% |
|
Romania |
3% |
70 831 |
18% |
|
Sweden |
3% |
65 872 |
17% |
|
Spain |
2% |
59 041 |
18% |
|
Austria |
2% |
21 945 |
6% |
|
Denmark |
2% |
39 314 |
14% |
|
Latvia |
1% |
24 002 |
13% |
Import trading partners’ ranking in the descending order from the largest share to the lowest in percentage terms
|
Poland’s trading partners (countries of origin) |
Share of countries of origin in the overall import turnover |
Absolute increase |
Rate of increase |
|
6 months in 2017 against 6 months in 2016 |
6 months in 2017 against 6 months in 2016 |
||
|
Germany |
40% |
648 940 |
11% |
|
the Czech Republic |
8% |
-48 484 |
-4% |
|
the Netherlands |
6% |
101 725 |
11% |
|
Italy |
5% |
94 999 |
12% |
|
Belgium |
5% |
146 770 |
21% |
|
Slovakia |
5% |
61 354 |
9% |
|
France |
5% |
55 500 |
8% |
|
Lithuania |
3% |
118 560 |
29% |
|
Sweden |
3% |
-6 602 |
-1% |
|
Spain |
3% |
69 284 |
16% |
|
Hungary |
3% |
92 237 |
23% |
|
Austria |
3% |
-42 468 |
-9% |
|
the UK |
2% |
23 773 |
10% |
|
Finland |
2% |
10 650 |
4% |
|
Denmark |
1% |
38 870 |
26% |
2. Changes in Poland’s commodity structure of export and import with EU countries

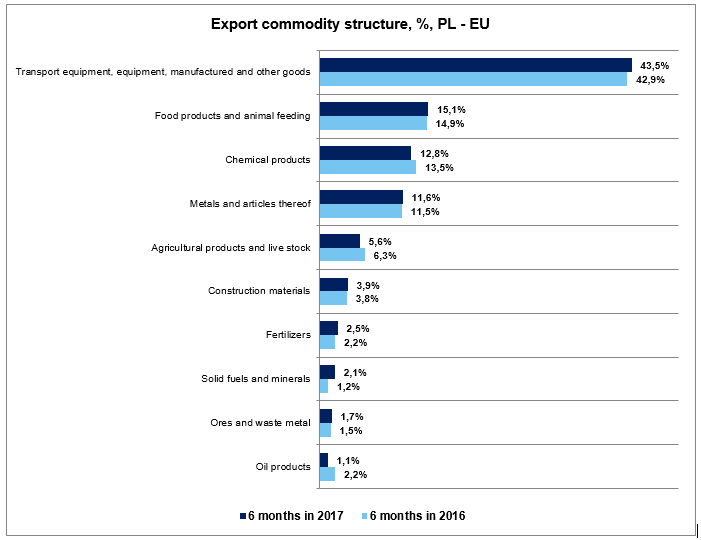
The following product groups underlie Polish exports in the first 6 months of 2017: Transport equipment, equipment, manufactured goods (43.5% of the total volume of exports, +0.6 pp), food products and animal feeding (15.1%, +0.2 pp), chemical products (12.8%, -0.7 pp), metals and articles thereof (11.6%, +0.1 pp) followed by agricultural products (5.6%, -0.7 ), construction materials (3.9%, +0.1 pp), fertilizers (2.5%, + 0.3 pp), solid fuels and minerals (2.1%, +0.9 p.), ores (1.7%, +0.2 pp) and oil products (1.1%, -1.1 pp).

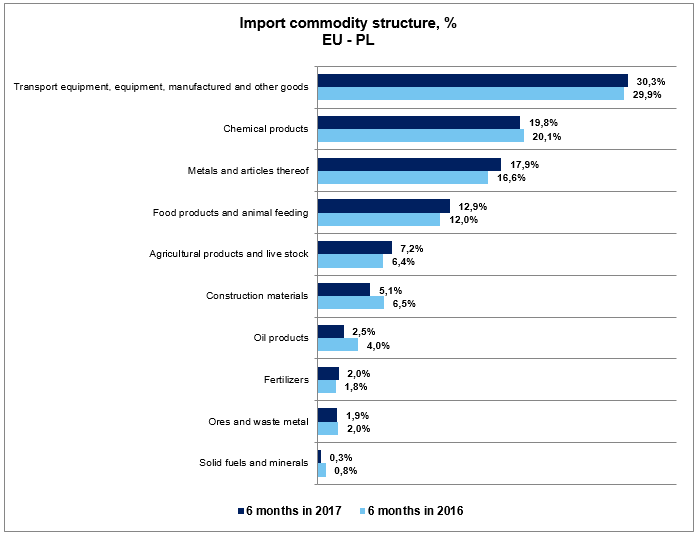
The commodity structure of Poland’s imports for the first 6 months of 2017 looks as follows: transport equipment, equipment and industrial products (30.3% of total imports, +0.4 pp), chemical products (19.8%, -0.3 pp), metals and articles thereof (17.9%, +1.3 pp), food products and animal feeding (12.9%, +0.9 pp), agricultural products (7.2%, +0.8 pp), construction materials (5.1%, -1.4%), petroleum products (2.5%, -1.5%), fertilizers (2%, +0.2%), ores (1.9%; -0.1 pp), solid fuels and minerals (0.3%, -0.5 pp).

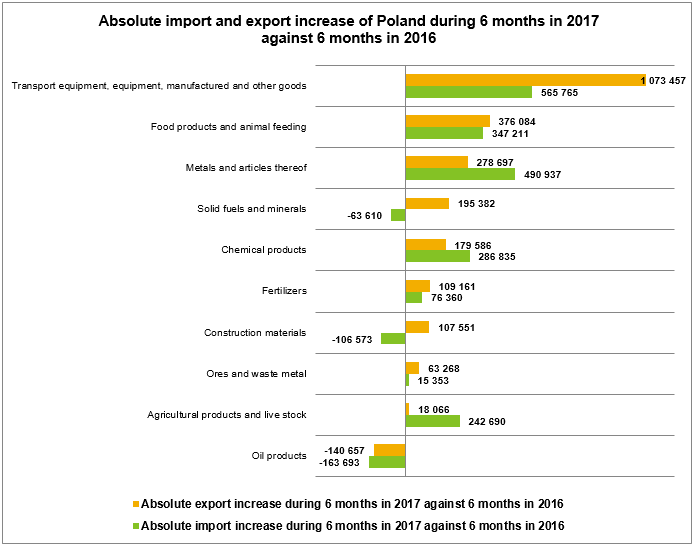
The growth in export supplies in the first 6 months of 2017 over the same period in 2016 occurred in following categories: transport equipment, equipment, industrial goods 1,073,457 tons (+16%), food products and animal feeding 376,084 tons (+16.1%), metals 278,697 tons (+15.5%), solid fuels and minerals 195,382 tons (+104.4%), chemical products 179,586 tons (+8.5%), fertilizers 109,161 tons (+31.8%), construction materials 107,551 tons (+18%), ores 63,268 tons (+26.4%) and agricultural products 18,066 tons (+1.8%).
The decrease in exports delivery for petroleum products totaled -142,844 tons (-58.4%).
The increase in imports during the six months of 2017 over the same period in 2016 was recorded in the following categories: transport equipment, equipment, industrial products 565,765 tons (+13%), metals and articles thereof 490,937 tons (+20.3%), food products and animal feeding 347,211 tons (+19.9%), chemical products 286,835 tons (+9.8%), agricultural products 242,690 tons (+26.1%), fertilizers 76,360 tons (+29.9%) and ore 15,353 tons (+5.2%).
Negative trends was observed in such categories as solid fuels and minerals -63,610 tons (-56,6%), construction materials -106,673 tons (-11.3%) and oil products -163,693 tons (-28.46%).
The overview has been prepared by TELS Marketing Department, based on external sources.