1. Dynamics of macro-indicators
Foreign trade statistics according to state agencies
|
Jan.-June 2016 |
Jan.-June 2017 |
Absolute increase |
Rate of increase |
|
|
Trade turnover, thousand US dollars |
545 489 |
599 703 |
54 214 |
9.9% |
|
Volume of imports, thousand US dollars |
282 270 |
317 433 |
35 163 |
12.5% |
|
Volume of exports, thousand US dollars |
263 219 |
282 270 |
19 051 |
7.2% |
|
Balance of foreign trade, thousand US dollars |
-19 051 |
-35 163 |
-16 112 |
84.6% |
According to the National Statistics Agency of Great Britain, British foreign trade turnover in January-June 2017 amounted to 599.7 billion £ with an increase of 9.9% over the same period in 2016, while exports totaled 282.3 billion £ (+7.2%) and imports amounted to 317.4 billion £ (+12.5%). From the total volume of trade in in the first half of 2017, 47.1% accounted for exports and 52.9% – for imports. The negative balance of foreign trade turnover amounted to -35.2 billion £.
Dynamics of foreign trade (according to Eurostat)
According to Eurostat (road transport), the volume of imports expressed in physical terms to the UK from the countries of the European Union (BE, BG, CY, CZ, DE, EE, ES, FI, GR, HU, IE, IT, LT, LU, LV, MT, PL, PT, RO, SK) in January-June 2017 totaled 16,197,064 tons with an increase of 3.7% over January-June 2016. The volume of exports in January-June 2017 amounted to 9,113,905 tons making an increase of 6.5% over the same period in 2016.
Major trading partners of Great Britain (road transport)
The most important foreign trade partners of Great Britain among the EU countries in 2016 were Germany, Belgium, Ireland, Spain, Italy, Poland, the Czech Republic, Portugal, Hungary and Romania accounting for 97% of foreign trade turnover.
Speaking about the share of the major partners in foreign turnover in the period under review, 34% accounted for Germany, 16% – for Belgium and 15% – for Ireland.
Dynamics in cooperation between Great Britain and its major trading partners (road transport)
Export trading partners’ ranking in the descending order from the largest share to the lowest in percentage terms
|
Trading partners of Great Britain (recipient countries) |
Share of recipient countries in the overall export turnover |
Absolute increase |
Rate of increase |
|
6 months in 2017 against 6 months in 2016 |
6 months in 2017 against 6 months in 2016 |
||
|
Germany |
32% |
231 737 |
9% |
|
Ireland |
23% |
165 459 |
9% |
|
Belgium |
18% |
254 471 |
19% |
|
Spain |
11% |
25 599 |
3% |
|
Italy |
5% |
62 820 |
17% |
|
Poland |
3% |
12 946 |
5% |
|
the Czech Republic |
2% |
27 176 |
15% |
|
Portugal |
1% |
-10 635 |
-8% |
Import trading partners’ ranking in the descending order from the largest share to the lowest in percentage terms
|
Trading partners of Great Britain (countries of origin) |
Share of countries of origin in the overall import turnover |
Absolute increase |
Rate of increase |
|
6 months in 2017 against 6 months in 2016 |
6 months in 2017 against 6 months in 2016 |
||
|
Germany |
34% |
56 358 |
1% |
|
Belgium |
15% |
156 246 |
7% |
|
Spain |
15% |
33 545 |
1% |
|
Ireland |
11% |
82 363 |
5% |
|
Italy |
8% |
-8 683 |
-1% |
|
Poland |
6% |
142 498 |
16% |
|
the Czech Republic |
3% |
-6 827 |
-2% |
|
Portugal |
2% |
14 910 |
6% |
|
Hungary |
2% |
268 |
0% |

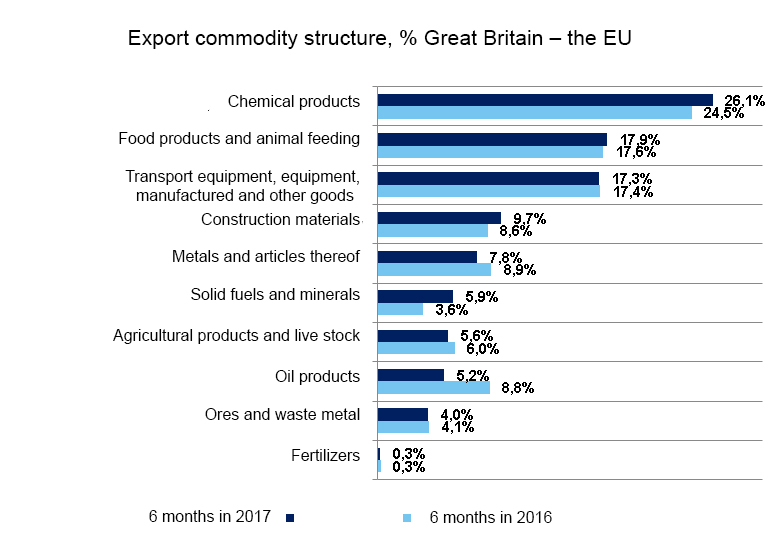
The following product groups underlie British exports in January-June 2017: chemical products (26.1%, 1.6 pp), followed by food products and animal feeding (17.9%, +0.3 pp), transport equipment, equipment, manufactured goods (17.3%, -1 pp), construction materials (9.7%, +0.9 pp), etc.
The following product groups underlie British imports in January-June 2017: transport equipment, equipment and industrial products (31.3% of total imports, -0.9 pp), food products and animal feeding (18.6%, +0.2 pp), chemical products (17.7%, +0.7 pp), construction materials (11.5%, +1.1 pp), agricultural products (10.2%, -0.3 pp), etc.
Growth in exports in the first 6 months of 2017 over the same period in 2016 occurred in the following categories: chemical products 276,796 tons (+13.1%), solid fuels and minerals 229,979 tons (+74.1%), construction materials 141,916 tons (+19.1%), food products an animal feeding 120,821 tons (+8%), transport equipment, equipment, and manufactured goods 85,395 (+5.7%), ores 13,989 (+4%). Negative export delivery trend was observed in such categories as fertilizers -898 tons (-3.6%), agricultural products -12,308 tons (-2.4%), metals -55,007 tons (-7.2%), oil products -278,012 tons (-36.8%).
The increase in imports was recorded in the following categories: construction materials 223,799 tons (+13.7%), chemical products 202,440 tons (+7.6%), food products and animal feeding 138,387 tons (+4.8%), metals and articles thereof 134,930 tons (+13.6%), solid fuels and minerals 52,862 tons (+64.7%), agricultural products 16,715 tons (+1%), fertilizers 7,355 tons (+13.9%). Decrease in imports in 2016 over 2015 was observed in such categories as transport equipment, equipment, and manufactured goods -16,172 tons (0.3%), ores -20,935 tons (-26.3%), oil products -165,667 tons (-39.2%).